This is a tutorial on creating a bar chart in PHP with the GD library. A link to the full source code can be found at the bottom of this page.
Step 1 – Create chart data.
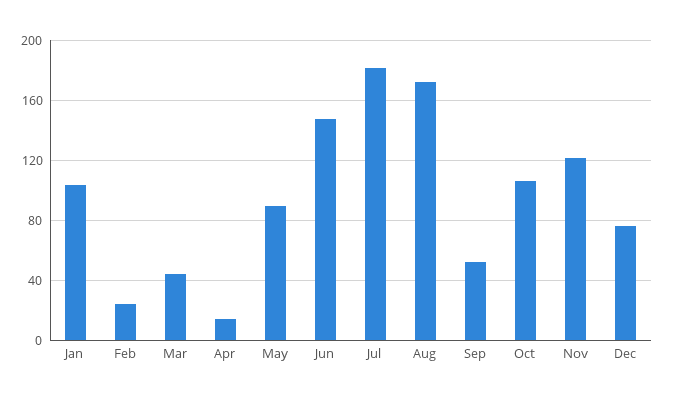
The data used in this demo is an array with the twelve months of the year as keys and a random value between 0 and 200 as values.
/*
 * Chart data
 */

$data = [
    'Jan' => 103,
    'Feb' => 24,
    'Mar' => 44,
    'Apr' => 14,
    'May' => 89,
    'Jun' => 147,
    'Jul' => 181,
    'Aug' => 172,
    'Sep' => 52,
    'Oct' => 106,
    'Nov' => 121,
    'Dec' => 76,
];
Step 2 – Settings and init image.
This code defines the dimensions of the image and the location of the chart inside this image. Also, a new image is created and colors used for the different elements are allocated. The font used (OpenSans-Regular.ttf) must be located in the same directory as the php-file. It can be downloaded from Google Fonts here.
/*
 * Chart settings and create image
 */

// Image dimensions
$imageWidth = 700;
$imageHeight = 400;

// Grid dimensions and placement within image
$gridTop = 40;
$gridLeft = 50;
$gridBottom = 340;
$gridRight = 650;
$gridHeight = $gridBottom - $gridTop;
$gridWidth = $gridRight - $gridLeft;

// Bar and line width
$lineWidth = 1;
$barWidth = 20;

// Font settings
$font = 'OpenSans-Regular.ttf';
$fontSize = 10;

// Margin between label and axis
$labelMargin = 8;

// Max value on y-axis
$yMaxValue = 200;

// Distance between grid lines on y-axis
$yLabelSpan = 40;

// Init image
$chart = imagecreate($imageWidth, $imageHeight);

// Setup colors
$backgroundColor = imagecolorallocate($chart, 255, 255, 255);
$axisColor = imagecolorallocate($chart, 85, 85, 85);
$labelColor = $axisColor;
$gridColor = imagecolorallocate($chart, 212, 212, 212);
$barColor = imagecolorallocate($chart, 47, 133, 217);

imagefill($chart, 0, 0, $backgroundColor);

imagesetthickness($chart, $lineWidth);
Step 3 – Draw grid lines with labels on y-axis.
The following code draws the grey horizontal grid lines with labels on the y-axis. The distance between these grid lines are defined by the variable $yLabelSpan, which is 40. Since the max value of y is 200, this means that a grid line will be placed at 0, 40, 80, 120, 160 and 200. This is converted to pixels by multiplying it with the grid height (in pixels) and then dividing by yMaxValue.
The y-axis labels are right aligned by using the method imagettfbbox. This method returns an 8-element array which represents the bounding box of a text. This allows us to calculate the width of the label rendered by the imagettftext method, and then calculate the x-coordinate for the label by subtracting the label width and label margin from the chart’s left side position.
/*
 * Print grid lines bottom up
 */

for($i = 0; $i <= $yMaxValue; $i += $yLabelSpan) {
    $y = $gridBottom - $i * $gridHeight / $yMaxValue;

    // draw the line
    imageline($chart, $gridLeft, $y, $gridRight, $y, $gridColor);

    // draw right aligned label
    $labelBox = imagettfbbox($fontSize, 0, $font, strval($i));
    $labelWidth = $labelBox[4] - $labelBox[0];

    $labelX = $gridLeft - $labelWidth - $labelMargin;
    $labelY = $y + $fontSize / 2;

    imagettftext($chart, $fontSize, 0, $labelX, $labelY, $labelColor, $font, strval($i));
}
Step 4 - Draw x- and y-axis.
Draw two black lines which represent the x- and y-axis.
/*
 * Draw x- and y-axis
 */

imageline($chart, $gridLeft, $gridTop, $gridLeft, $gridBottom, $axisColor);
imageline($chart, $gridLeft, $gridBottom, $gridRight, $gridBottom, $axisColor);
Step 5 - Draw bars with labels on x-axis.
The distance between the center of the bars is calculated by dividing the number of data elements with the total grid width.
The labels on the x-axis are aligned by first calculating the label width using the imagettfbbox (in the same way as the y-axis labels). The bars and the labels are then centered by subtracting half the width from the center position of the bar.
The height of the bar is converted to pixels by dividing the value with yMaxValue multiplied with the gridHeight (in pixels).
/*
 * Draw the bars with labels
 */

$barSpacing = $gridWidth / count($data);
$itemX = $gridLeft + $barSpacing / 2;

foreach($data as $key => $value) {
    // Draw the bar
    $x1 = $itemX - $barWidth / 2;
    $y1 = $gridBottom - $value / $yMaxValue * $gridHeight;
    $x2 = $itemX + $barWidth / 2;
    $y2 = $gridBottom - 1;

    imagefilledrectangle($chart, $x1, $y1, $x2, $y2, $barColor);

    // Draw the label
    $labelBox = imagettfbbox($fontSize, 0, $font, $key);
    $labelWidth = $labelBox[4] - $labelBox[0];

    $labelX = $itemX - $labelWidth / 2;
    $labelY = $gridBottom + $labelMargin + $fontSize;

    imagettftext($chart, $fontSize, 0, $labelX, $labelY, $labelColor, $font, $key);

    $itemX += $barSpacing;
}
Step 6 - Output image.
The code below outputs the image directly to the browser.
/*
 * Output image to browser
 */

header('Content-Type: image/png');
imagepng($chart);
It is also possible to save the image to a file:
/*
 * Output image to file
 */

imagepng($chart, 'chart.png');
Links
- Full source code: https://gist.github.com/inf123/a1a4d3986731b94bc058
- OpenSans Font: https://www.google.com/fonts/specimen/Open+Sans